Moving to Millville, Delaware
About Millville, Delaware
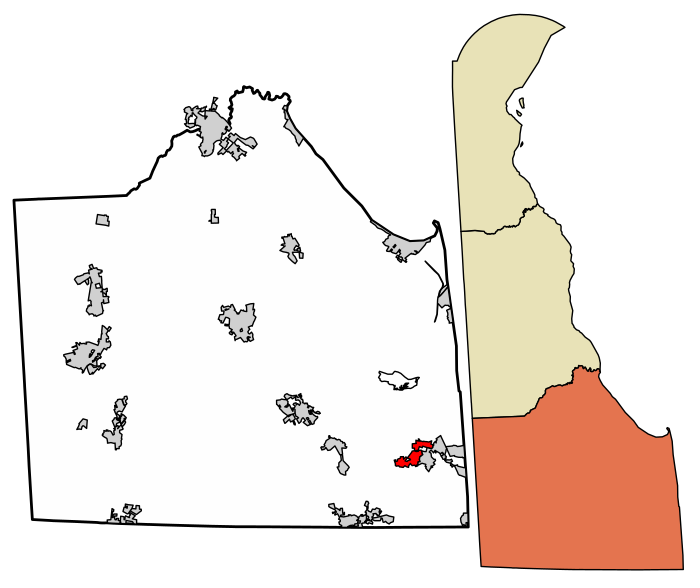
Millville is a town in Sussex County, Delaware, United States. The population in 2020 was 1,825, It is part of the Salisbury, Maryland-Delaware Metropolitan Statistical Area and lies within Baltimore Hundred.
Gender
| Gender | Millville | Delaware | Country |
|---|---|---|---|
| Female | 52% | 51.7% | 50.8% |
| Male | 48% | 48.3% | 49.2% |
Gender
Female Male
Household Income
< $10000 $10K to $15K $15K to $25K $25K to $35K $35K to $50K $50K to $75K $75K to $100K $100K to $150K $150K to $200K $200K or more
| Income | Millville | Delaware | Country |
|---|---|---|---|
| Less than $10,000 | 4.6% | 5.2% | 5.8% |
| $10,000 to $14,999 | 0.7% | 3.5% | 4.1% |
| $15,000 to $24,999 | 2% | 6.8% | 8.5% |
| $25,000 to $34,999 | 5.8% | 8.9% | 8.6% |
| $35,000 to $49,999 | 17.2% | 11.7% | 12.0% |
| $50,000 to $74,999 | 21.8% | 17.7% | 17.2% |
| $75,000 to $99,999 | 12.5% | 13.9% | 12.8% |
| $100,000 to $149,999 | 23.9% | 17% | 15.6% |
| $150,000 to $199,999 | 5.8% | 7.7% | 7.1% |
| $200,000 or more | 5.7% | 7.6% | 8.3% |
Education
< 9th Grade 9-12th Grade High School or GED Other College Associate Degree Bachelor Degree Masters Degree Professional Degree Doctorate Degree
| Education | Millville | Delaware | Country |
|---|---|---|---|
| < 9th Grade | 4% | 3% | 5.0% |
| 9-12th Grade | 1% | 6% | 7.0% |
| High School or GED | 21% | 31% | 27.0% |
| Other College | 15% | 19% | 20.0% |
| Associate's Degree | 7% | 8% | 9% |
| Bachelor's Degree | 35% | 19% | 20.0% |
| Master's Degree | 15% | 10% | 9.0% |
| Professional Degree | 1% | 2% | 2.0% |
| Doctorate Degree | 1% | 2% | 1.0% |
Household Income
Millville Delaware Country
Education
Millville Delaware Country
Race / Ethnicity
White African American American Indian Asian Hispanic Hawaiian Mixed Other
| Ethnicity | Millville | Delaware | Country |
|---|---|---|---|
| White | 90.9% | 61.5% | 60.1% |
| African American | 0.6% | 21.5% | 12.2% |
| American Indian | 0% | 0.3% | 0.6% |
| Asian | 0.5% | 4% | 5.6% |
| Hawaiian | 0% | 0% | 0.2% |
| Other | 0% | 0.4% | 0.3% |
| Multiracial | 0.9% | 2.9% | 2.8% |
| Hispanic | 7% | 9.4% | 18.2% |
Race / Ethnicity
Millville Delaware Country
- ALABAMA
- ALASKA
- ARIZONA
- ARKANSAS
- CALIFORNIA
- COLORADO
- CONNECTICUT
- DELAWARE
- FLORIDA
- GEORGIA
- HAWAII
- IDAHO
- ILLINOIS
- INDIANA
- IOWA
- KANSAS
- KENTUCKY
- LOUISIANA
- MAINE
- MARYLAND
- MASSACHUSETTS
- MICHIGAN
- MINNESOTA
- MISSISSIPPI
- MISSOURI
- MONTANA
- NEBRASKA
- NEVADA
- NEW HAMPSHIRE
- NEW JERSEY
- NEW MEXICO
- NEW YORK
- NORTH CAROLINA
- NORTH DAKOTA
- OHIO
- OKLAHOMA
- OREGON
- PENNSYLVANIA
- RHODE ISLAND
- SOUTH CAROLINA
- SOUTH DAKOTA
- TENNESSEE
- TEXAS
- UTAH
- VERMONT
- VIRGINIA
- WASHINGTON
- WEST VIRGINIA
- WISCONSIN
- WYOMING