Moving to Edwardsville, Illinois
About Edwardsville, Illinois
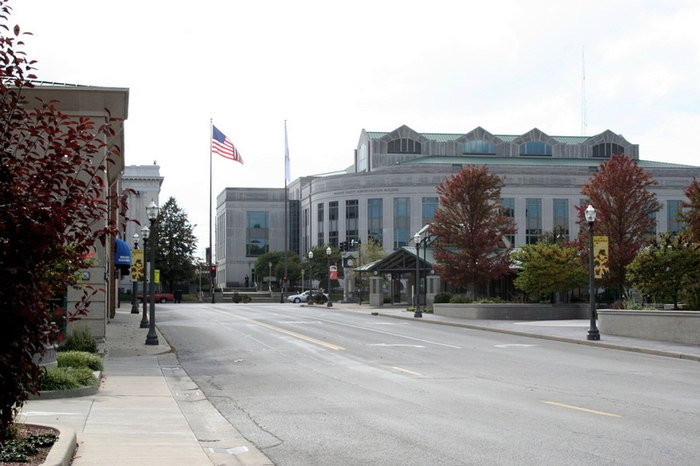
Edwardsville is a city in Madison County, Illinois, United States, and its county seat. The population was 26,808 as of the 2020 census. The city was named in honor of Ninian Edwards, former governor of the Illinois Territory. Edwardsville is a part of Southern Illinois and the Metro East region within Greater St. Louis, located 18 miles (29 km) northeast of downtown St. Louis.
Southern Illinois University Edwardsville, the Edwardsville Arts Center, the Edwardsville Journal, the Madison County Record, and the Edwardsville Intelligencer are based in Edwardsville. Edwardsville High School and Metro-East Lutheran High School serve students in the area. Edwardsville also serves as the headquarters for Prairie Farms Dairy, one of the largest dairy cooperatives in the United States and ranked in the top 10 of the largest privately held companies in the St. Louis region. The city is part of the Edwardsville School District, which also includes the villages of Glen Carbon, Hamel and Moro, as well as the township areas around them.
Gender
| Gender | Edwardsville | Illinois | Country |
|---|---|---|---|
| Female | 52.2% | 50.9% | 50.8% |
| Male | 47.8% | 49.1% | 49.2% |
Gender
Household Income
| Income | Edwardsville | Illinois | Country |
|---|---|---|---|
| Less than $10,000 | 5.3% | 6.1% | 5.8% |
| $10,000 to $14,999 | 4.2% | 3.7% | 4.1% |
| $15,000 to $24,999 | 5.5% | 8.1% | 8.5% |
| $25,000 to $34,999 | 7.7% | 8.1% | 8.6% |
| $35,000 to $49,999 | 9.4% | 11.2% | 12.0% |
| $50,000 to $74,999 | 17.7% | 16.7% | 17.2% |
| $75,000 to $99,999 | 10.9% | 12.9% | 12.8% |
| $100,000 to $149,999 | 17.1% | 16.6% | 15.6% |
| $150,000 to $199,999 | 9.8% | 7.8% | 7.1% |
| $200,000 or more | 12.4% | 8.8% | 8.3% |
Education
| Education | Edwardsville | Illinois | Country |
|---|---|---|---|
| < 9th Grade | 1% | 5% | 5.0% |
| 9-12th Grade | 3% | 6% | 7.0% |
| High School or GED | 17% | 26% | 27.0% |
| Other College | 16% | 20% | 20.0% |
| Associate's Degree | 8% | 8% | 9% |
| Bachelor's Degree | 31% | 22% | 20.0% |
| Master's Degree | 17% | 10% | 9.0% |
| Professional Degree | 3% | 2% | 2.0% |
| Doctorate Degree | 4% | 1% | 1.0% |
Household Income
Education
Race / Ethnicity
| Ethnicity | Edwardsville | Illinois | Country |
|---|---|---|---|
| White | 84.7% | 60.8% | 60.1% |
| African American | 8.7% | 13.9% | 12.2% |
| American Indian | 0.4% | 0.1% | 0.6% |
| Asian | 2% | 5.5% | 5.6% |
| Hawaiian | 0% | 0% | 0.2% |
| Other | 0.1% | 0.2% | 0.3% |
| Multiracial | 1.7% | 2.2% | 2.8% |
| Hispanic | 2.3% | 17.2% | 18.2% |
Race / Ethnicity
- ALABAMA
- ALASKA
- ARIZONA
- ARKANSAS
- CALIFORNIA
- COLORADO
- CONNECTICUT
- DELAWARE
- FLORIDA
- GEORGIA
- HAWAII
- IDAHO
- ILLINOIS
- INDIANA
- IOWA
- KANSAS
- KENTUCKY
- LOUISIANA
- MAINE
- MARYLAND
- MASSACHUSETTS
- MICHIGAN
- MINNESOTA
- MISSISSIPPI
- MISSOURI
- MONTANA
- NEBRASKA
- NEVADA
- NEW HAMPSHIRE
- NEW JERSEY
- NEW MEXICO
- NEW YORK
- NORTH CAROLINA
- NORTH DAKOTA
- OHIO
- OKLAHOMA
- OREGON
- PENNSYLVANIA
- RHODE ISLAND
- SOUTH CAROLINA
- SOUTH DAKOTA
- TENNESSEE
- TEXAS
- UTAH
- VERMONT
- VIRGINIA
- WASHINGTON
- WEST VIRGINIA
- WISCONSIN
- WYOMING