Moving to Freeport, Illinois
About Freeport, Illinois
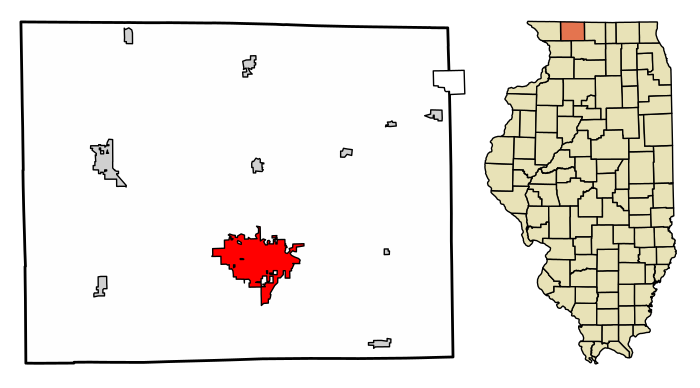
Freeport is the largest city in Stephenson County, Illinois, United States, and its county seat. The population was 23,973 at the 2020 census, and the mayor of Freeport is Jodi Miller, elected in 2017. Freeport is known for hosting the second Lincoln–Douglas debate of 1858, and as "Pretzel City, USA", due to a popular local German bakery that became well known for its prolific pretzel production after it opened in 1869. Freeport High School's mascot is the Pretzel to honor its heritage.
Gender
| Gender | Freeport | Illinois | Country |
|---|---|---|---|
| Female | 53.9% | 50.9% | 50.8% |
| Male | 46.1% | 49.1% | 49.2% |
Gender
Female Male
Household Income
< $10000 $10K to $15K $15K to $25K $25K to $35K $35K to $50K $50K to $75K $75K to $100K $100K to $150K $150K to $200K $200K or more
| Income | Freeport | Illinois | Country |
|---|---|---|---|
| Less than $10,000 | 10.3% | 6.1% | 5.8% |
| $10,000 to $14,999 | 7.5% | 3.7% | 4.1% |
| $15,000 to $24,999 | 15.3% | 8.1% | 8.5% |
| $25,000 to $34,999 | 11.7% | 8.1% | 8.6% |
| $35,000 to $49,999 | 15.1% | 11.2% | 12.0% |
| $50,000 to $74,999 | 17.9% | 16.7% | 17.2% |
| $75,000 to $99,999 | 8.3% | 12.9% | 12.8% |
| $100,000 to $149,999 | 9.1% | 16.6% | 15.6% |
| $150,000 to $199,999 | 2.7% | 7.8% | 7.1% |
| $200,000 or more | 2.1% | 8.8% | 8.3% |
Education
< 9th Grade 9-12th Grade High School or GED Other College Associate Degree Bachelor Degree Masters Degree Professional Degree Doctorate Degree
| Education | Freeport | Illinois | Country |
|---|---|---|---|
| < 9th Grade | 2% | 5% | 5.0% |
| 9-12th Grade | 7% | 6% | 7.0% |
| High School or GED | 34% | 26% | 27.0% |
| Other College | 29% | 20% | 20.0% |
| Associate's Degree | 9% | 8% | 9% |
| Bachelor's Degree | 12% | 22% | 20.0% |
| Master's Degree | 5% | 10% | 9.0% |
| Professional Degree | 1% | 2% | 2.0% |
| Doctorate Degree | 1% | 1% | 1.0% |
Household Income
Freeport Illinois Country
Education
Freeport Illinois Country
Race / Ethnicity
White African American American Indian Asian Hispanic Hawaiian Mixed Other
| Ethnicity | Freeport | Illinois | Country |
|---|---|---|---|
| White | 69.5% | 60.8% | 60.1% |
| African American | 17% | 13.9% | 12.2% |
| American Indian | 0.2% | 0.1% | 0.6% |
| Asian | 1.2% | 5.5% | 5.6% |
| Hawaiian | 0% | 0% | 0.2% |
| Other | 0.3% | 0.2% | 0.3% |
| Multiracial | 5.7% | 2.2% | 2.8% |
| Hispanic | 6.2% | 17.2% | 18.2% |
Race / Ethnicity
Freeport Illinois Country
- ALABAMA
- ALASKA
- ARIZONA
- ARKANSAS
- CALIFORNIA
- COLORADO
- CONNECTICUT
- DELAWARE
- FLORIDA
- GEORGIA
- HAWAII
- IDAHO
- ILLINOIS
- INDIANA
- IOWA
- KANSAS
- KENTUCKY
- LOUISIANA
- MAINE
- MARYLAND
- MASSACHUSETTS
- MICHIGAN
- MINNESOTA
- MISSISSIPPI
- MISSOURI
- MONTANA
- NEBRASKA
- NEVADA
- NEW HAMPSHIRE
- NEW JERSEY
- NEW MEXICO
- NEW YORK
- NORTH CAROLINA
- NORTH DAKOTA
- OHIO
- OKLAHOMA
- OREGON
- PENNSYLVANIA
- RHODE ISLAND
- SOUTH CAROLINA
- SOUTH DAKOTA
- TENNESSEE
- TEXAS
- UTAH
- VERMONT
- VIRGINIA
- WASHINGTON
- WEST VIRGINIA
- WISCONSIN
- WYOMING