Moving to Centerville, Iowa
About Centerville, Iowa
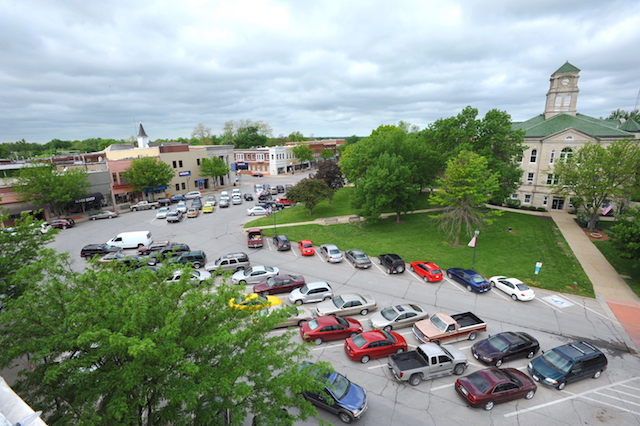
Centerville is a city in and the county seat of Appanoose County, Iowa, United States. The population was 5,412 in the 2020 census, a decline from 5,924 in 2000. After the turn of the 20th century Centerville's coal mining industry attracted European immigrants from Sweden, Italy, Croatia, and Albania. Centerville is also home of the largest town square in the state of Iowa.
Gender
| Gender | Centerville | Iowa | Country |
|---|---|---|---|
| Female | 54.4% | 50.3% | 50.8% |
| Male | 45.6% | 49.7% | 49.2% |
Gender
Female Male
Household Income
< $10000 $10K to $15K $15K to $25K $25K to $35K $35K to $50K $50K to $75K $75K to $100K $100K to $150K $150K to $200K $200K or more
| Income | Centerville | Iowa | Country |
|---|---|---|---|
| Less than $10,000 | 14.8% | 5.1% | 5.8% |
| $10,000 to $14,999 | 8.6% | 4% | 4.1% |
| $15,000 to $24,999 | 12.9% | 8.6% | 8.5% |
| $25,000 to $34,999 | 16.2% | 9.3% | 8.6% |
| $35,000 to $49,999 | 15% | 13.1% | 12.0% |
| $50,000 to $74,999 | 15.6% | 19.1% | 17.2% |
| $75,000 to $99,999 | 7.4% | 14.3% | 12.8% |
| $100,000 to $149,999 | 5.8% | 15.9% | 15.6% |
| $150,000 to $199,999 | 2.6% | 5.6% | 7.1% |
| $200,000 or more | 1.1% | 5% | 8.3% |
Education
< 9th Grade 9-12th Grade High School or GED Other College Associate Degree Bachelor Degree Masters Degree Professional Degree Doctorate Degree
| Education | Centerville | Iowa | Country |
|---|---|---|---|
| < 9th Grade | 2% | 1% | 5.0% |
| 9-12th Grade | 9% | 5% | 7.0% |
| High School or GED | 33% | 31% | 27.0% |
| Other College | 28% | 21% | 20.0% |
| Associate's Degree | 11% | 12% | 9% |
| Bachelor's Degree | 13% | 20% | 20.0% |
| Master's Degree | 3% | 7% | 9.0% |
| Professional Degree | 1% | 2% | 2.0% |
| Doctorate Degree | 0% | 1% | 1.0% |
Household Income
Centerville Iowa Country
Education
Centerville Iowa Country
Race / Ethnicity
White African American American Indian Asian Hispanic Hawaiian Mixed Other
| Ethnicity | Centerville | Iowa | Country |
|---|---|---|---|
| White | 94.1% | 85% | 60.1% |
| African American | 1.1% | 3.6% | 12.2% |
| American Indian | 0% | 0.3% | 0.6% |
| Asian | 0.2% | 2.5% | 5.6% |
| Hawaiian | 0% | 0.1% | 0.2% |
| Other | 0% | 0.1% | 0.3% |
| Multiracial | 1.8% | 2.2% | 2.8% |
| Hispanic | 2.8% | 6.2% | 18.2% |
Race / Ethnicity
Centerville Iowa Country
- ALABAMA
- ALASKA
- ARIZONA
- ARKANSAS
- CALIFORNIA
- COLORADO
- CONNECTICUT
- DELAWARE
- FLORIDA
- GEORGIA
- HAWAII
- IDAHO
- ILLINOIS
- INDIANA
- IOWA
- KANSAS
- KENTUCKY
- LOUISIANA
- MAINE
- MARYLAND
- MASSACHUSETTS
- MICHIGAN
- MINNESOTA
- MISSISSIPPI
- MISSOURI
- MONTANA
- NEBRASKA
- NEVADA
- NEW HAMPSHIRE
- NEW JERSEY
- NEW MEXICO
- NEW YORK
- NORTH CAROLINA
- NORTH DAKOTA
- OHIO
- OKLAHOMA
- OREGON
- PENNSYLVANIA
- RHODE ISLAND
- SOUTH CAROLINA
- SOUTH DAKOTA
- TENNESSEE
- TEXAS
- UTAH
- VERMONT
- VIRGINIA
- WASHINGTON
- WEST VIRGINIA
- WISCONSIN
- WYOMING