Moving to Chalmette, Louisiana
About Chalmette, Louisiana
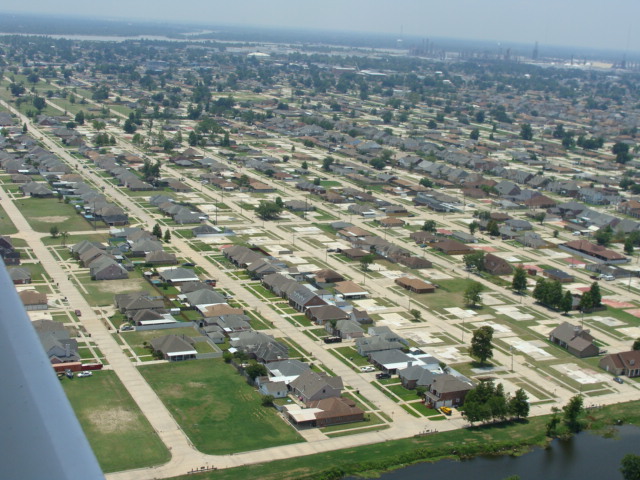
Chalmette ( shal-MET) is a census-designated place (CDP) in, and the parish seat of, St. Bernard Parish in southeastern Louisiana, United States. The 2010 census reported that Chalmette had 16,751 people; 2011 population was listed as 17,119; however, the pre-Katrina population was 32,069 at the 2000 census. At the 2020 U.S. census, its population rebounded to 21,562. Chalmette is part of the New Orleans–Metairie–Kenner metropolitan statistical area. Chalmette is located east of downtown New Orleans and south of Arabi, towards Lake Borgne.
The community was named for plantation owner Louis-Xavier Martin de Lino de Chalmette. Chalmette was appended to the family name after acquiring their Louisiana plantation, in honour of Louis-Xavier Martin de Lino's paternal great-grandmother, Antoinette Chalmette (died 1711) "Chalmette," in French, means pasture, or fallow land, (and traces to the Proto-Celtic word "kalm").
Gender
| Gender | Chalmette | Louisiana | Country |
|---|---|---|---|
| Female | 49.1% | 51.2% | 50.8% |
| Male | 50.9% | 48.8% | 49.2% |
Gender
Household Income
| Income | Chalmette | Louisiana | Country |
|---|---|---|---|
| Less than $10,000 | 12.8% | 8.9% | 5.8% |
| $10,000 to $14,999 | 5% | 5.5% | 4.1% |
| $15,000 to $24,999 | 11.9% | 12.2% | 8.5% |
| $25,000 to $34,999 | 10.9% | 10.2% | 8.6% |
| $35,000 to $49,999 | 11.1% | 12.5% | 12.0% |
| $50,000 to $74,999 | 17% | 16.3% | 17.2% |
| $75,000 to $99,999 | 13.3% | 11.4% | 12.8% |
| $100,000 to $149,999 | 8.9% | 13% | 15.6% |
| $150,000 to $199,999 | 4.7% | 5.3% | 7.1% |
| $200,000 or more | 4.4% | 4.7% | 8.3% |
Education
| Education | Chalmette | Louisiana | Country |
|---|---|---|---|
| < 9th Grade | 5% | 5% | 5.0% |
| 9-12th Grade | 13% | 9% | 7.0% |
| High School or GED | 31% | 33% | 27.0% |
| Other College | 30% | 21% | 20.0% |
| Associate's Degree | 8% | 7% | 9% |
| Bachelor's Degree | 9% | 16% | 20.0% |
| Master's Degree | 4% | 6% | 9.0% |
| Professional Degree | 0% | 2% | 2.0% |
| Doctorate Degree | 0% | 1% | 1.0% |
Household Income
Education
Race / Ethnicity
| Ethnicity | Chalmette | Louisiana | Country |
|---|---|---|---|
| White | 60.5% | 58.3% | 60.1% |
| African American | 23.5% | 31.9% | 12.2% |
| American Indian | 0.3% | 0.5% | 0.6% |
| Asian | 3.3% | 1.7% | 5.6% |
| Hawaiian | 0.1% | 0% | 0.2% |
| Other | 0.7% | 0.3% | 0.3% |
| Multiracial | 2.1% | 2% | 2.8% |
| Hispanic | 9.6% | 5.2% | 18.2% |
Race / Ethnicity
- ALABAMA
- ALASKA
- ARIZONA
- ARKANSAS
- CALIFORNIA
- COLORADO
- CONNECTICUT
- DELAWARE
- FLORIDA
- GEORGIA
- HAWAII
- IDAHO
- ILLINOIS
- INDIANA
- IOWA
- KANSAS
- KENTUCKY
- LOUISIANA
- MAINE
- MARYLAND
- MASSACHUSETTS
- MICHIGAN
- MINNESOTA
- MISSISSIPPI
- MISSOURI
- MONTANA
- NEBRASKA
- NEVADA
- NEW HAMPSHIRE
- NEW JERSEY
- NEW MEXICO
- NEW YORK
- NORTH CAROLINA
- NORTH DAKOTA
- OHIO
- OKLAHOMA
- OREGON
- PENNSYLVANIA
- RHODE ISLAND
- SOUTH CAROLINA
- SOUTH DAKOTA
- TENNESSEE
- TEXAS
- UTAH
- VERMONT
- VIRGINIA
- WASHINGTON
- WEST VIRGINIA
- WISCONSIN
- WYOMING