Moving to Sandusky, Ohio
About Sandusky, Ohio
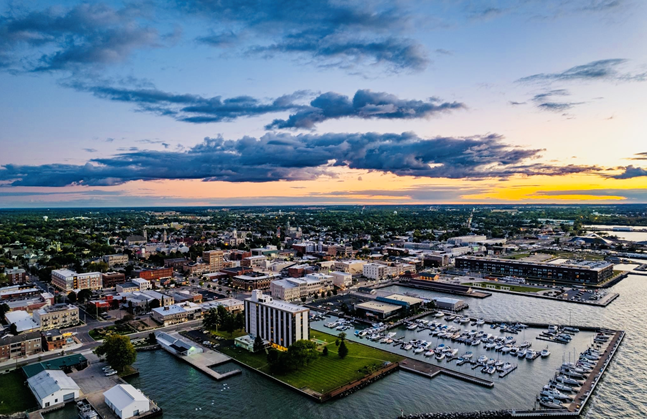
Sandusky ( san-DUSS-kee) is a city in Erie County, Ohio, United States, and its county seat. Situated on the southern shore of Lake Erie, Sandusky is located roughly midway between Toledo (45 miles (72 km) west) and Cleveland (50 miles (80 km) east). At the 2020 census, the city had a population of 25,095, and the Sandusky metropolitan area had 115,986 residents.
Sandusky was established in the early 19th century and developed as a port city at the head of Sandusky Bay. It is home to Cedar Point, one of the most popular amusement parks in the world, as well as water parks including Cedar Point Shores, Castaway Bay, Great Wolf Lodge, and Kalahari. The headquarters of Cedar Fair Entertainment Company were located in the city until it merged with Six Flags, who retains some administrative offices in Sandusky.
Gender
| Gender | Sandusky | Ohio | Country |
|---|---|---|---|
| Female | 52.3% | 51% | 50.8% |
| Male | 47.7% | 49% | 49.2% |
Gender
Household Income
| Income | Sandusky | Ohio | Country |
|---|---|---|---|
| Less than $10,000 | 12.4% | 6.6% | 5.8% |
| $10,000 to $14,999 | 3.1% | 4.4% | 4.1% |
| $15,000 to $24,999 | 14.8% | 9.5% | 8.5% |
| $25,000 to $34,999 | 14% | 9.6% | 8.6% |
| $35,000 to $49,999 | 16.5% | 13.3% | 12.0% |
| $50,000 to $74,999 | 18.5% | 18.4% | 17.2% |
| $75,000 to $99,999 | 10.2% | 13% | 12.8% |
| $100,000 to $149,999 | 6.5% | 14.4% | 15.6% |
| $150,000 to $199,999 | 2.5% | 5.6% | 7.1% |
| $200,000 or more | 1.5% | 5.2% | 8.3% |
Education
| Education | Sandusky | Ohio | Country |
|---|---|---|---|
| < 9th Grade | 2% | 2% | 5.0% |
| 9-12th Grade | 10% | 7% | 7.0% |
| High School or GED | 40% | 33% | 27.0% |
| Other College | 22% | 20% | 20.0% |
| Associate's Degree | 8% | 9% | 9% |
| Bachelor's Degree | 12% | 18% | 20.0% |
| Master's Degree | 4% | 8% | 9.0% |
| Professional Degree | 1% | 2% | 2.0% |
| Doctorate Degree | 1% | 1% | 1.0% |
Household Income
Education
Race / Ethnicity
| Ethnicity | Sandusky | Ohio | Country |
|---|---|---|---|
| White | 64.6% | 78.3% | 60.1% |
| African American | 22.4% | 12.2% | 12.2% |
| American Indian | 0.6% | 0.1% | 0.6% |
| Asian | 0.4% | 2.3% | 5.6% |
| Hawaiian | 0% | 0% | 0.2% |
| Other | 0.2% | 0.3% | 0.3% |
| Multiracial | 4.5% | 2.9% | 2.8% |
| Hispanic | 7.2% | 3.9% | 18.2% |
Race / Ethnicity
- ALABAMA
- ALASKA
- ARIZONA
- ARKANSAS
- CALIFORNIA
- COLORADO
- CONNECTICUT
- DELAWARE
- FLORIDA
- GEORGIA
- HAWAII
- IDAHO
- ILLINOIS
- INDIANA
- IOWA
- KANSAS
- KENTUCKY
- LOUISIANA
- MAINE
- MARYLAND
- MASSACHUSETTS
- MICHIGAN
- MINNESOTA
- MISSISSIPPI
- MISSOURI
- MONTANA
- NEBRASKA
- NEVADA
- NEW HAMPSHIRE
- NEW JERSEY
- NEW MEXICO
- NEW YORK
- NORTH CAROLINA
- NORTH DAKOTA
- OHIO
- OKLAHOMA
- OREGON
- PENNSYLVANIA
- RHODE ISLAND
- SOUTH CAROLINA
- SOUTH DAKOTA
- TENNESSEE
- TEXAS
- UTAH
- VERMONT
- VIRGINIA
- WASHINGTON
- WEST VIRGINIA
- WISCONSIN
- WYOMING