Moving to Lancaster, Pennsylvania
About Lancaster, Pennsylvania
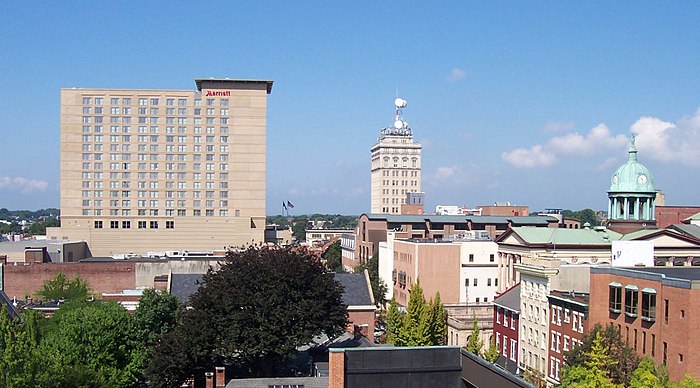
Lancaster ( LANG-ki-stər) is a city in and the county seat of Lancaster County, Pennsylvania, and one of the oldest inland cities in the United States. With a population of 58,039 at the 2020 census, it is the tenth-most-populous city in the state. The Lancaster metropolitan area population is 552,984, making it the second largest in the South Central Pennsylvania area.
The city's primary industries include healthcare, tourism, public administration, manufacturing, and both professional and semi-professional services. Lancaster is a hub of Pennsylvania's Dutch Country.
Lancaster is located 59 miles (95 km) southwest of Allentown and 61 miles (98 km) west of Philadelphia.
Gender
| Gender | Lancaster | Pennsylvania | Country |
|---|---|---|---|
| Female | 52% | 51% | 50.8% |
| Male | 48% | 49% | 49.2% |
Gender
Household Income
| Income | Lancaster | Pennsylvania | Country |
|---|---|---|---|
| Less than $10,000 | 7.5% | 5.8% | 5.8% |
| $10,000 to $14,999 | 6% | 4% | 4.1% |
| $15,000 to $24,999 | 11.1% | 8.8% | 8.5% |
| $25,000 to $34,999 | 11.8% | 9% | 8.6% |
| $35,000 to $49,999 | 14.1% | 12.1% | 12.0% |
| $50,000 to $74,999 | 18.8% | 17.6% | 17.2% |
| $75,000 to $99,999 | 13.7% | 13.2% | 12.8% |
| $100,000 to $149,999 | 12.1% | 15.7% | 15.6% |
| $150,000 to $199,999 | 2.9% | 6.7% | 7.1% |
| $200,000 or more | 2% | 7.1% | 8.3% |
Education
| Education | Lancaster | Pennsylvania | Country |
|---|---|---|---|
| < 9th Grade | 11% | 2% | 5.0% |
| 9-12th Grade | 10% | 6% | 7.0% |
| High School or GED | 33% | 34% | 27.0% |
| Other College | 15% | 16% | 20.0% |
| Associate's Degree | 8% | 9% | 9% |
| Bachelor's Degree | 15% | 20% | 20.0% |
| Master's Degree | 6% | 9% | 9.0% |
| Professional Degree | 1% | 2% | 2.0% |
| Doctorate Degree | 1% | 2% | 1.0% |
Household Income
Education
Race / Ethnicity
| Ethnicity | Lancaster | Pennsylvania | Country |
|---|---|---|---|
| White | 38.8% | 75.7% | 60.1% |
| African American | 12.8% | 10.6% | 12.2% |
| American Indian | 0% | 0.1% | 0.6% |
| Asian | 4.5% | 3.5% | 5.6% |
| Hawaiian | 0.1% | 0% | 0.2% |
| Other | 0.2% | 0.3% | 0.3% |
| Multiracial | 4.7% | 2.2% | 2.8% |
| Hispanic | 38.9% | 7.6% | 18.2% |
Race / Ethnicity
- ALABAMA
- ALASKA
- ARIZONA
- ARKANSAS
- CALIFORNIA
- COLORADO
- CONNECTICUT
- DELAWARE
- FLORIDA
- GEORGIA
- HAWAII
- IDAHO
- ILLINOIS
- INDIANA
- IOWA
- KANSAS
- KENTUCKY
- LOUISIANA
- MAINE
- MARYLAND
- MASSACHUSETTS
- MICHIGAN
- MINNESOTA
- MISSISSIPPI
- MISSOURI
- MONTANA
- NEBRASKA
- NEVADA
- NEW HAMPSHIRE
- NEW JERSEY
- NEW MEXICO
- NEW YORK
- NORTH CAROLINA
- NORTH DAKOTA
- OHIO
- OKLAHOMA
- OREGON
- PENNSYLVANIA
- RHODE ISLAND
- SOUTH CAROLINA
- SOUTH DAKOTA
- TENNESSEE
- TEXAS
- UTAH
- VERMONT
- VIRGINIA
- WASHINGTON
- WEST VIRGINIA
- WISCONSIN
- WYOMING