Moving to Temple, Texas
About Temple, Texas
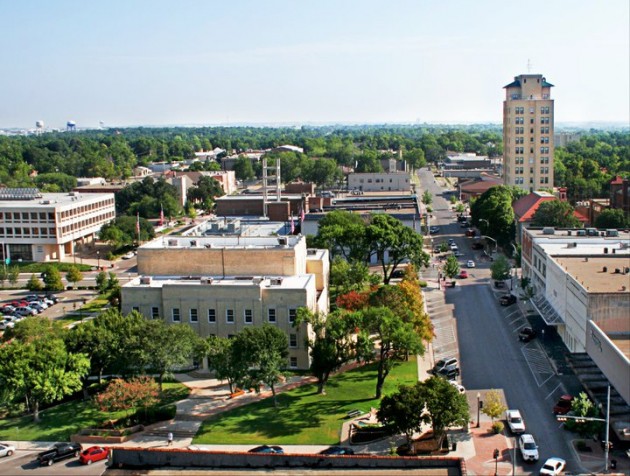
Temple is a city in Bell County, Texas, United States. As of 2020, the city has a population of 82,073 according to the U.S. census. Temple lies in the region referred to as Central Texas and is a principal city in the Killeen–Temple–Fort Hood metropolitan area, (Fort Hood was redesignated "Fort Cavazos" in 2023) which as of the 2020 Census had a population of 475,367. Located off Interstate 35, Temple is 65 miles north of Austin, 34 miles south of Waco and 27 miles east of Killeen.
Gender
| Gender | Temple | Texas | Country |
|---|---|---|---|
| Female | 53.2% | 50.3% | 50.8% |
| Male | 46.8% | 49.7% | 49.2% |
Gender
Female Male
Household Income
< $10000 $10K to $15K $15K to $25K $25K to $35K $35K to $50K $50K to $75K $75K to $100K $100K to $150K $150K to $200K $200K or more
| Income | Temple | Texas | Country |
|---|---|---|---|
| Less than $10,000 | 8.4% | 6% | 5.8% |
| $10,000 to $14,999 | 4.6% | 3.9% | 4.1% |
| $15,000 to $24,999 | 11.4% | 8.4% | 8.5% |
| $25,000 to $34,999 | 10.2% | 8.9% | 8.6% |
| $35,000 to $49,999 | 11.6% | 12.3% | 12.0% |
| $50,000 to $74,999 | 19.5% | 17.6% | 17.2% |
| $75,000 to $99,999 | 12.6% | 12.5% | 12.8% |
| $100,000 to $149,999 | 13.5% | 15.6% | 15.6% |
| $150,000 to $199,999 | 4.6% | 7% | 7.1% |
| $200,000 or more | 3.2% | 7.8% | 8.3% |
Education
< 9th Grade 9-12th Grade High School or GED Other College Associate Degree Bachelor Degree Masters Degree Professional Degree Doctorate Degree
| Education | Temple | Texas | Country |
|---|---|---|---|
| < 9th Grade | 6% | 7% | 5.0% |
| 9-12th Grade | 7% | 8% | 7.0% |
| High School or GED | 24% | 25% | 27.0% |
| Other College | 24% | 22% | 20.0% |
| Associate's Degree | 11% | 7% | 9% |
| Bachelor's Degree | 17% | 20% | 20.0% |
| Master's Degree | 7% | 8% | 9.0% |
| Professional Degree | 2% | 2% | 2.0% |
| Doctorate Degree | 2% | 1% | 1.0% |
Household Income
Temple Texas Country
Education
Temple Texas Country
Race / Ethnicity
White African American American Indian Asian Hispanic Hawaiian Mixed Other
| Ethnicity | Temple | Texas | Country |
|---|---|---|---|
| White | 51.8% | 41.4% | 60.1% |
| African American | 14.5% | 11.8% | 12.2% |
| American Indian | 0.2% | 0.2% | 0.6% |
| Asian | 1.6% | 4.9% | 5.6% |
| Hawaiian | 0% | 0.1% | 0.2% |
| Other | 0% | 0.2% | 0.3% |
| Multiracial | 3% | 2% | 2.8% |
| Hispanic | 28.9% | 39.4% | 18.2% |
Race / Ethnicity
Temple Texas Country
- ALABAMA
- ALASKA
- ARIZONA
- ARKANSAS
- CALIFORNIA
- COLORADO
- CONNECTICUT
- DELAWARE
- FLORIDA
- GEORGIA
- HAWAII
- IDAHO
- ILLINOIS
- INDIANA
- IOWA
- KANSAS
- KENTUCKY
- LOUISIANA
- MAINE
- MARYLAND
- MASSACHUSETTS
- MICHIGAN
- MINNESOTA
- MISSISSIPPI
- MISSOURI
- MONTANA
- NEBRASKA
- NEVADA
- NEW HAMPSHIRE
- NEW JERSEY
- NEW MEXICO
- NEW YORK
- NORTH CAROLINA
- NORTH DAKOTA
- OHIO
- OKLAHOMA
- OREGON
- PENNSYLVANIA
- RHODE ISLAND
- SOUTH CAROLINA
- SOUTH DAKOTA
- TENNESSEE
- TEXAS
- UTAH
- VERMONT
- VIRGINIA
- WASHINGTON
- WEST VIRGINIA
- WISCONSIN
- WYOMING